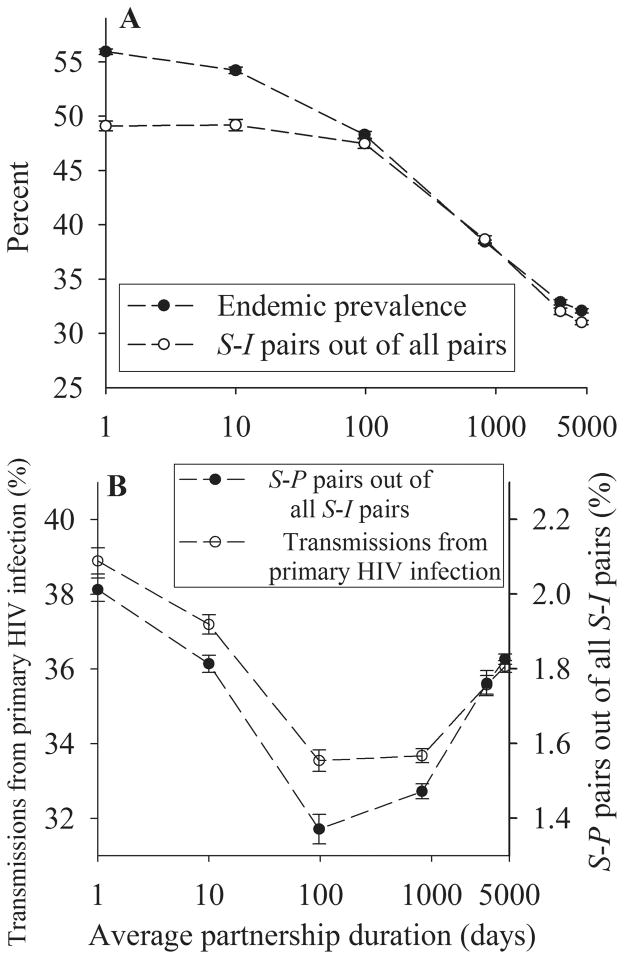
FIGURE 3.
Simulation results when partnership duration is varied. The mean degree n = 1.5 and the mean frequency of sex acts per partnership per day c = 0.3333. S-I and S-P pairs denote a pair of a susceptible person and any infected person, and a pair of a susceptible person and a person infected with primary HIV infection, respectively. Each data point is the mean from 10 simulation runs, and error bars indicate one standard deviation. A, Endemic prevalence and the fraction of S-I pairs out of all pairs across partnership duration. B, Fraction of transmissions during primary HIV infection and the fraction of S-P pairs out of all S-I pairs across partnership duration.

