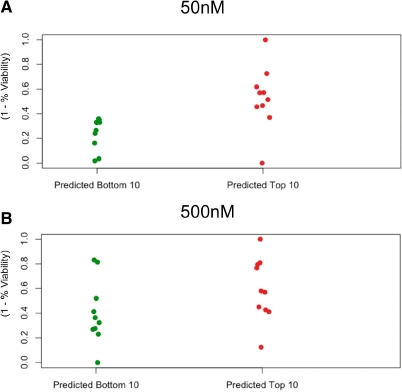
Fig. 4.
Experimental confirmation of predictions for 40 FDA-approved cancer drugs in seven glioma cell lines. FOR each drug, the mean of predicted IC50 response over the seven cell lines was computed. The percent viability of cell lines relative to a control was measured at 50 and 500 nm of drug concentration after growth of 48 h normalized over the [0, 1] interval. A two-tailed significance test (correlation test in R) of the Pearson product moment correlation between predicted and measured IC50 values across all 37 cell lines showed significance for both concentration points at P < 0.001.

