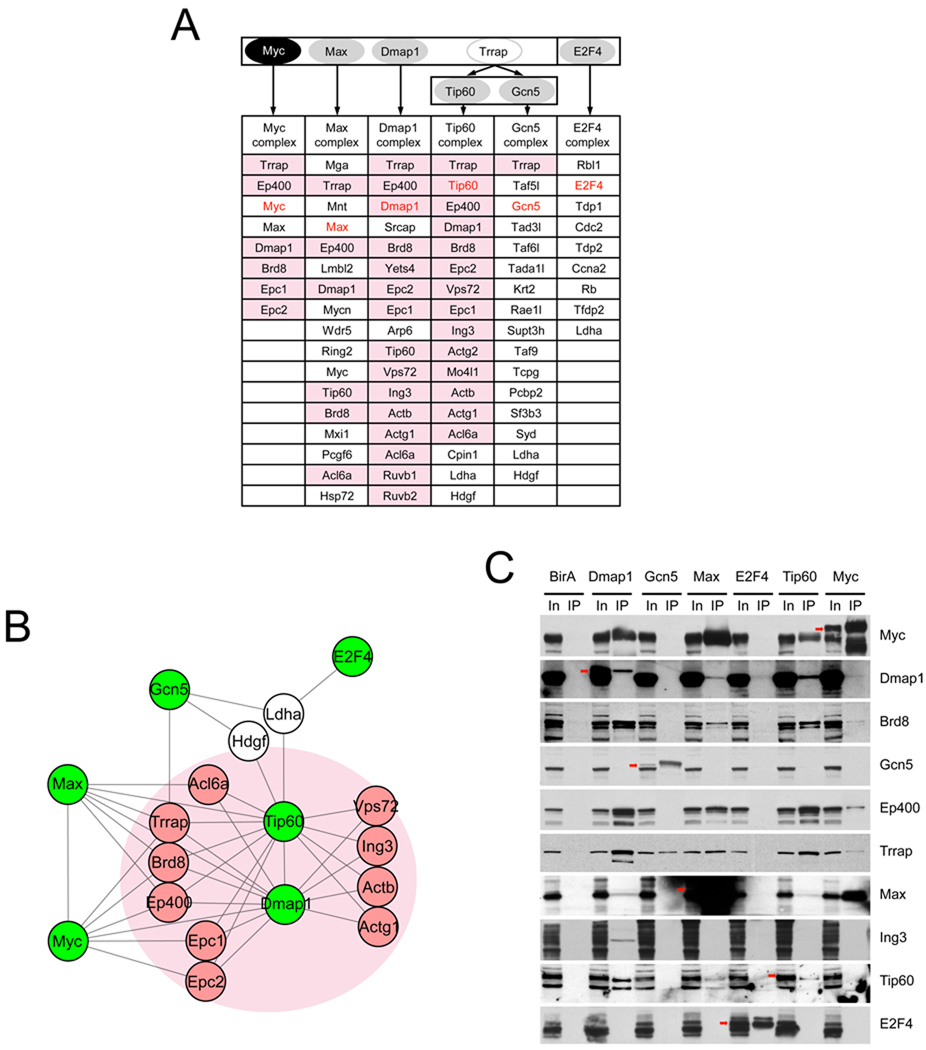
Figure 1. Myc-centered protein-protein interaction network in ES cells.
(A) Schematic representation of the strategy for mapping a Myc-centered protein–protein interaction network in ES cells. High-confidence components of multiprotein complexes were identified and listed in the table. Pink cells represent NuA4 complex proteins.
(B) Depiction of the features of the Myc-centered protein-protein interaction network. Proteins with green labels are biotin tagged proteins and pink circles indicate NuA4 complex proteins Proteins identified by multiple biotin tagged factors are shown. Entire protein interaction network is shown in Figure S1C. See also Table S1.
(C) Validation of the interaction network by co-immunoprecipitation.

