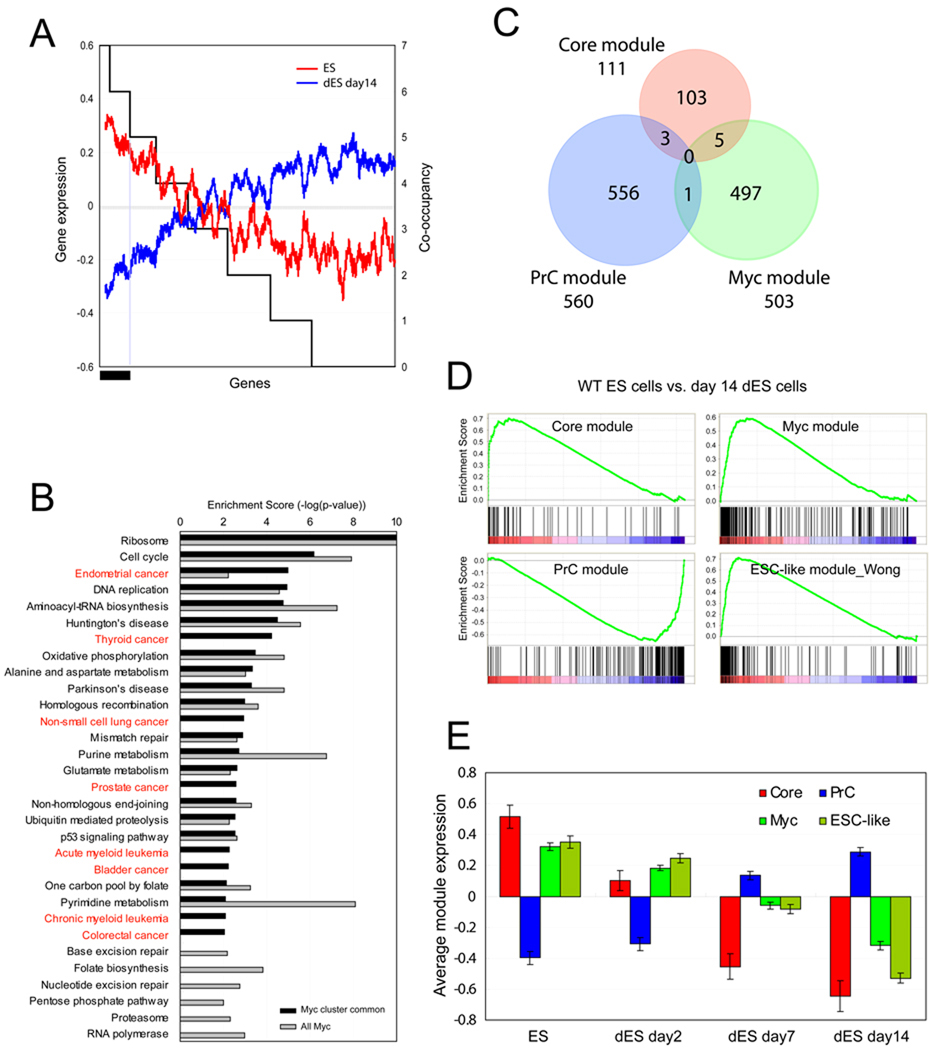
Figure 4. ES cell modules.
(A) Gene expression profiles (log2, left y-axis) upon J1 ES cell differentiation (wild type ES cells: ES, differentiated ES cells for 14 days: dES day 14) are shown as moving window averaged lines (ES; red line, dES day 14; blue line, bin size 100 and step size 1). Randomized genes are sorted (x-axis) by the target co-occupancy of 7 factors in the Myc cluster (right y-axis). Black bar represents target genes co-occupied by at least 6 factors among the 7 factors in the Myc cluster.
(B) Enrichment of KEGG pathways. All Myc target genes (gray bars, total 3733 genes) and genes co-occupied by at least 6 factors among the 7 factors tested marked by black bar in (A) (black bars, total 1756 genes). See also Figure S3A, S3B and Table S3.
(C) ES cell modules: Three ES cell modules are defined based on the target co-occupancy within each cluster shown in Figure 2D. See also Table S3.
(D) GSEA analyses show the gene activity of the three ES cell modules (Core, PrC and Myc modules) as well as the previously defined ESC-like module (Wong et al. 2008a) upon ES cell differentiation (wild type ES cells; ES vs. 14 days differentiated ES cells; dES).
(E) Average gene expression values (log2) of each module (C) are tested upon ES cell differentiation (ES day0, dES day2, dES day7, and dES day14, respectively). Data are represented as mean ± SEM. See also Figure S2B and Figure S3C.

