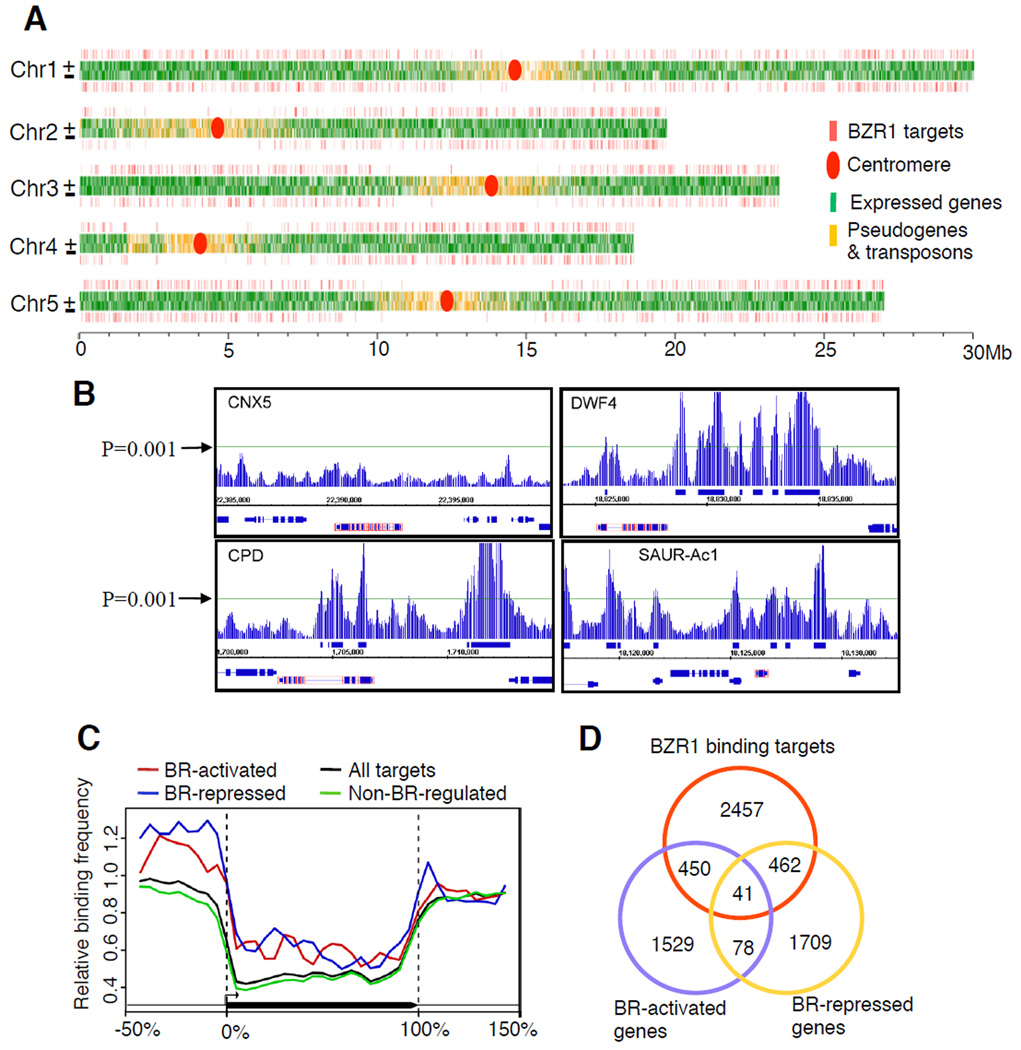
Figure 2. Identification of BZR1 direct target genes using ChIP-chip.
(A) Distribution of BZR1 binding sites along the five chromosomes of Arabidopsis. (B) ChIP-chip data displayed by Integrated Genome Browser software at selected chromosomal regions around known BZR1 target and non-target genes (red-box). The horizontal line indicates the cut off P-value (0.001). (C) Frequency of BZR1 binding sites along the virtually normalized gene models (promoter is −50-0%, coding region 0–100%, 3’ region 100–150%) of each class of BZR1 target genes. (D) Venn diagram shows the overlaps of BZR1 target genes (Table S2a) with BR-activated and BR-repressed genes (Table S5c).

