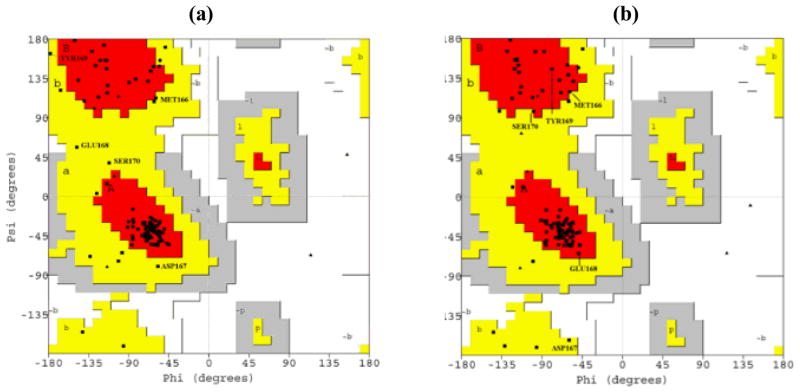
Fig. 5.
Ramachandran plots of <E200K>NMR and <E200K>NMR+D. (a) Ramachandran plot showing the values of (ϕ, ψ) angles of the average and energy-minimized structure of <E200K>NMR; (b) Ramachandran plot of <E200K>NMR+D. Only the residues of Loop 1 are shown. In (a), most of the residues in Loop 1 are found outside the most favourable (red) regions, while in (b), most of these residues lie within the most favourable regions.

