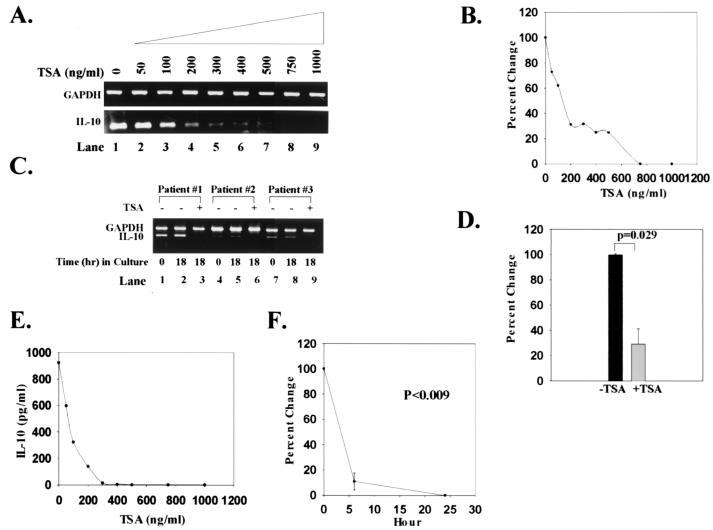
Figure 2.
Down-regulation of IL-10 transcript levels and protein expression by TSA. (A) Increasing concentrations of TSA (0–1,000 ng/ml) progressively decrease the amount of IL-10 mRNA relative to GAPDH mRNA. (B) Based on densitometric scanning of the gel in A, this graph quantifies the percent change in IL-10 transcript levels with increasing concentrations of TSA over 24 h. These data are representative of nine SLE subjects studied. T cells from normal controls do not express detectable IL-10 mRNA. (C) IL-10 and GAPDH transcripts from T cells of three SLE subjects are shown. Transcripts from freshly isolated T cells are shown in lanes 1, 4, and 7. Transcripts from T cells cultured for 18 h in the absence or presence of 1,000 ng/ml TSA are shown in lanes 2, 5, and 8 and 3, 6, and 9, respectively. These data are representative of nine SLE subjects studied. (D) Based on densitometric scanning of gels, this graph shows the percent change in amount of IL-10 mRNA from SLE T cells cultured in the absence or presence of 1,000 ng/ml TSA. (E) This graph illustrates the inhibition of IL-10 secretion by increasing concentrations of TSA over 24 h. (F) This graph depicts the percent change of IL-10 secretion over time. IL-10 protein secretion was undetectable in supernatants from normal T cells. Statistical analysis was performed by paired Student's t test.

