Fig. 4.
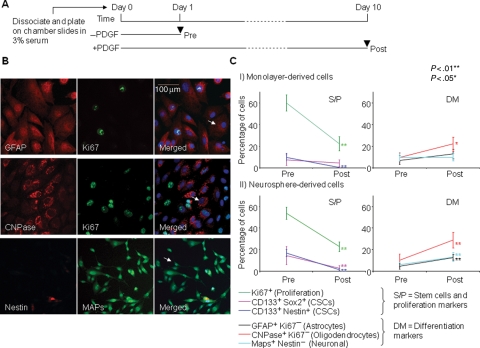
Neurosphere-derived cells undergo multipotent differentiation. (A) Schematic diagram of the protocol. (B) Differentiated astrocyte cells stained with GFAP (red) are negative for Ki67 (green) (first column), oligodendrocytes stained with CNPase (red) are negative for Ki67 (green) (second column), and neuronal cells stained with microtubule-associated proteins (MAPs; green) positivity are nestin (red) negative (third column). Arrows on merged images (bottom row) indicate the examples of counted differentiated cells. (C) The percentages of cells counted pre- and postdifferentiation in all cell lines grown as (I) monolayers or (II) neurospheres. CSCs refer to CSCs. Each value plotted represents the mean and SEM. derived from all 7 cell lines, with 3 independent experiments completed for each cell line. Significance values were determined using the paired t-test comparing values for pre- and postdifferentiation. **P < .01 and *P < .05.

