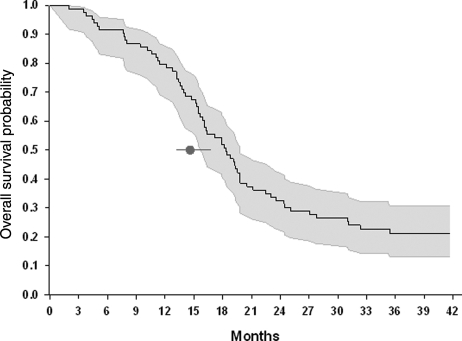
Fig. 2.
Kaplan–Meier survival curve. Kaplan–Meier survival curve for overall survival and 95% CI (shaded area) for patients age ≤70, the same age range as in the EORTC phase III trial.1 The black circle with 95% CI represents the mOS of 14.6 months for the EORTC III trial.

