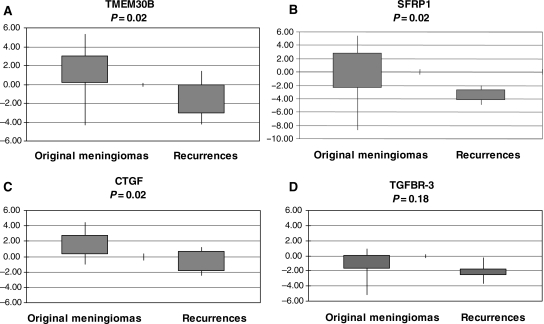
Fig. 2.
Validation of selected genes differentially expressed in original and recurrent meningioma by qRT–PCR analysis. (A) TMEM30B, (B) SFRP1, (C) CTGF, and (D) TGFBR3. Mean expression values related to the internal control glyceraldehyde 3-phosphate dehydrogenase (GAPDH) or TATA box binding protein (TBP) and to the mean of nontumoral meningothelial tissue pools are plotted. Box plots indicate the expression values of the 25th and 75th percentiles, and the extremes of the vertical lines represent the maximum and the minimum log2 expression. P < .05 for all genes except for TGFBR3.

