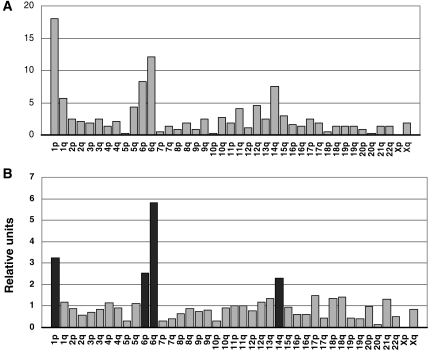
Fig. 5.
(A) Diagram of the frequency of locations of genes differentially expressed in original (O) and recurrent (R) meningiomas. (B) The locations of the genes differentially expressed (O vs R) relative to the locations of the genes in the microarray. Black bars indicate the significant and most frequent locations.

