Fig. 3.
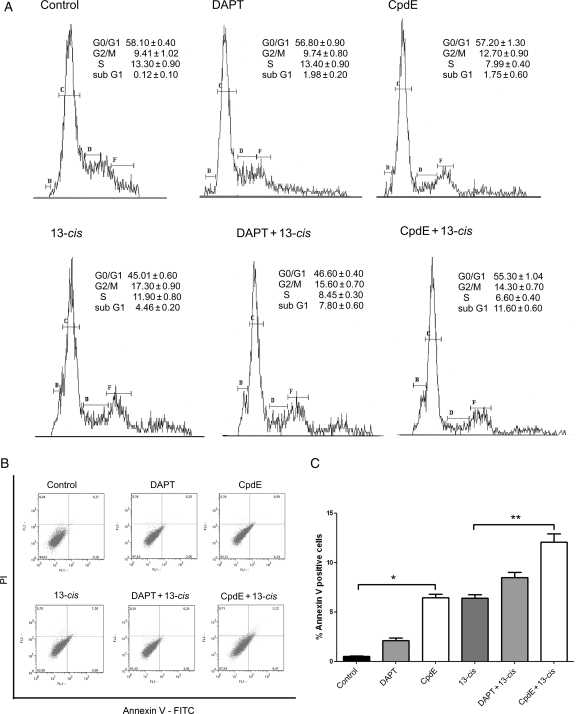
Cell cycle and apoptosis analysis of neuroblastoma cells after GSIs and 13-cis RA treatments. (A) Cell cycle analysis of IMR-32 neuroblastoma cells after 5 days treatment with GSIs alone, 13-cis RA, and the GSIs + 13-cis RA combination. (B and C) Determination of apoptosis after 3 days treatment with the above-mentioned compounds. (B) Annexin V/PI double staining and flow cytometry assays. x-axis indicates the numbers of Annexin V-FITC-stained cells. y-axis indicates the number of PI-stained cells. (C) Determination of apoptosis percentages based on the accumulation of Annexin V-positive cells in the A4 area. *P < .001 vs control; **P < .001 vs 13-cis RA.

