Fig. 2.
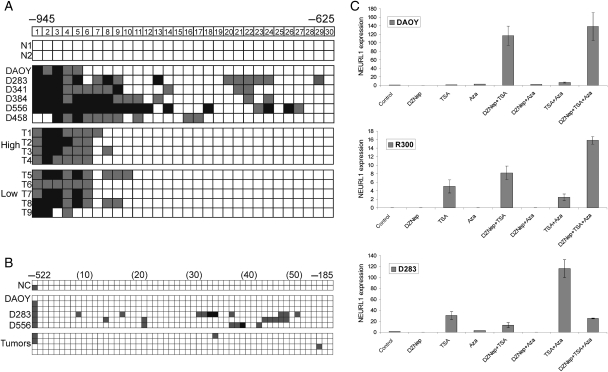
Analysis of epigenetic mechanisms controlling NEURL1 expression. Promoter hypermethylation analysis of the NEURL1 promoter by bisulfite sequencing. (A) −945 to −625 and (B) −522 to −185 from the transcription start site. The CpG dinucleotides are numbered. N, normal cerebellum; T, primary tumor; high, expression equivalent to that in normal cerebellum; low, expression <10% that in normal cerebellum. Black squares, >75% methylation; gray squares, 25%–75% methylation; white squares, <25% methylation. Representative results for the tumors analyzed are shown in (B); NC, normal cerebellum. (C) Histone modification analysis is depicted for DAOY, R300, and D283 MB cell lines. NEURL1 expression was measured following drug treatments. Control, vehicle treatment; DZNep, 5 µM 3-deazaneplanocin A; TSA, 200 nM trichostatin A; Aza, 5 µM 5-aza-2′-deoxycytidine.

