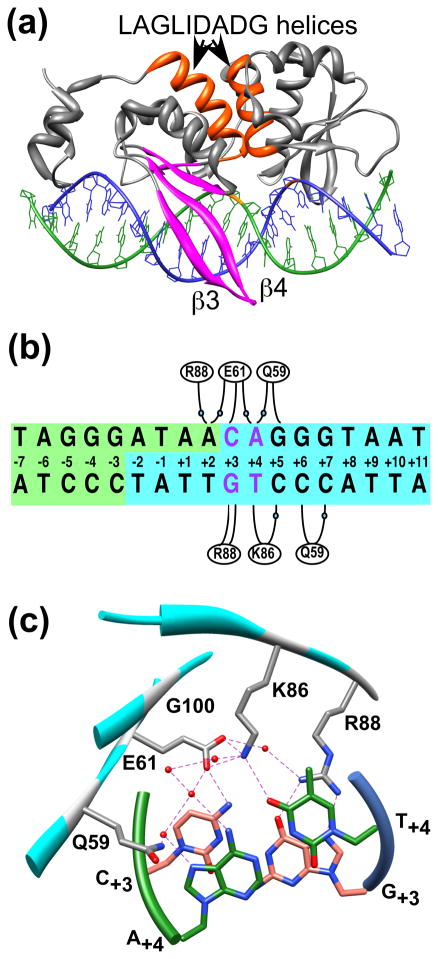
Figure 1.
A) A ribbon representation of the 2.25 Å X-ray crystal structure of I-SceI bound to a 24 base-pair duplex containing the 18-bp recognition sequence (1R7M 11). Highlighted within the protein secondary structure elements (colored gray) are the two LAGLIDADG α-helices (colored orange) and β-sheet 1 (colored magenta). The nucleotides of the top (colored green) and bottom (colored blue) DNA strands are depicted in a stick representation. The positions of the scissile phosphodiester bonds within the DNA backbone are indicated (colored orange). B) Schematic representation of the 18-bp I-SceI recognition sequence showing the cleavage reaction products in blue and green. Bases are numbered from the center of the 4-bp overhang generated by DNA cleavage. Base-specific and water-mediated (indicated by blue spheres) contacts made to DNA by Gln59, Glu61, Lys86 and Arg88 are indicated. Base-pairs C/G+3 and A/T+4 are indicated (colored violet). C) A detailed view of a region of the I-SceI/DNA complex structure showing the locations of Gln59, Glu61, Lys86, Arg88 and Gly100 (colored gray) relative to the C/G+3 (colored salmon) and A/T+4 (colored green) base-pairs (depicted as sticks). The protein (cyan) and DNA strand (green and blue) backbones are represented with ribbons. Hydrogen bonds are indicated by dashed lines, and water molecules are represented by spheres (colored red).

