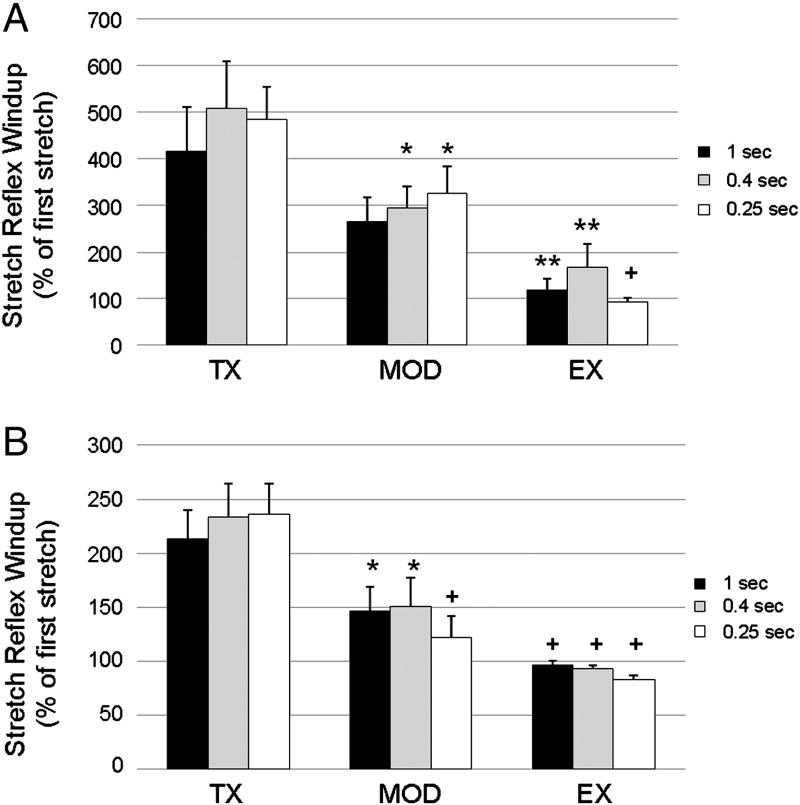
Figure 3. Comparison of SR wind-up of integrated EMG and peak torque at 49 days post Tx.
Peak wind-up is shown as a percentage of the first stretch with group means (±SE) plotted for various stretch intervals. A) Peak plantarflexion torque, and B) integrated gastrocnemius EMG showed similar patterns across groups. Tx (n=7) animals showed marked SR wind-up at all frequencies of stretch. Ex (n=8) and Mod (n=8) animals were prevented from developing SR wind-up. Significant differences from the Tx group are noted (*= p<0.05, ** = p<0.01, + = p<0.001).

