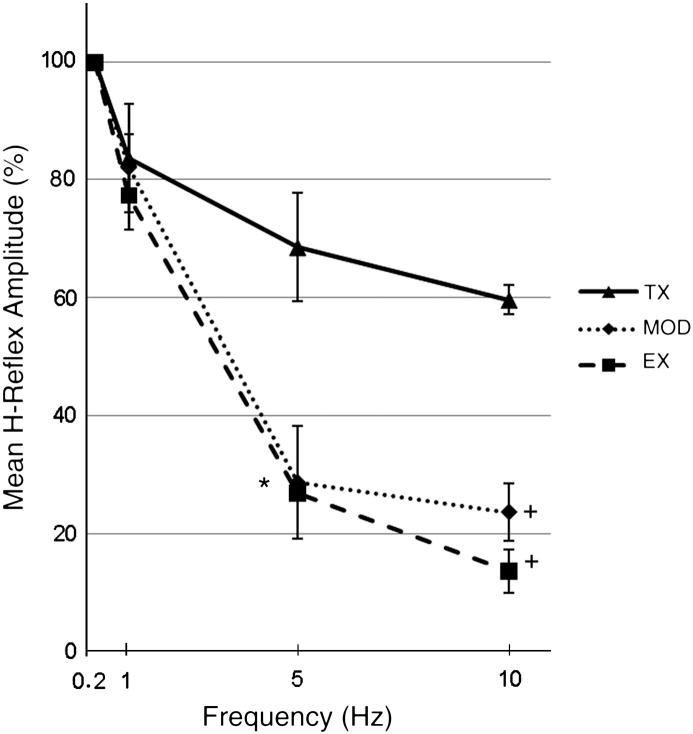
Figure 4. Frequency dependent depression of the H-Reflex.
Mean H-reflex amplitude at 0.2, 1, 5 and 10 Hz for transection (Tx, n=3), Exercise (Ex, n=4) and Modafinil treated animals (MOD, n=4) at 49 days post SCI. Data are normalized to 0.2 Hz values. Ex and MOD animals underwent 6 weeks of treatment. The Tx group failed to demonstrate normal habituation at higher frequencies. Ex and MOD groups both showed habituation that was significantly different than the Tx group at 5Hz (*p<0.05) and 10Hz (+p<0.001).

