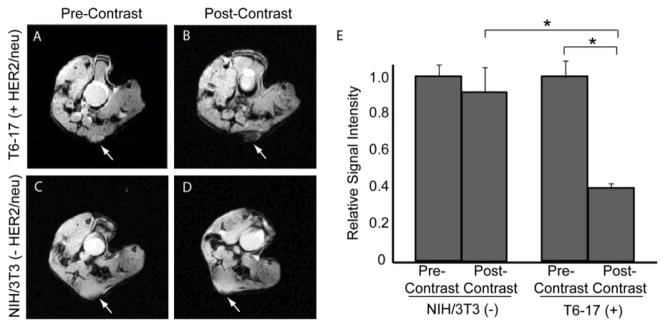
Figure 5.
MR images of SCID mice pre-injection and 24 hours post- injection of HER2-SPIO NPs and corresponding image analysis. Mice with HER2/neu-positive T6-17 tumor xenografts were imaged (A) pre-injection and (B) 24 hours post retro-orbital injection of 10 mg Fe/kg HER2-SPIO NPs. Tumors are indicated by white arrows. Mice with HER2/neu-negative NIH/3T3 tumor xenografts were imaged (C) pre- and (D) post-injection of HER2-SPIO NPs. (E) Quantitative analysis of MR images. Signal intensity for each tumor was normalized to surrounding muscle tissue and the relative signal intensity, rSI, was calculated as the quotient of the 24-hour post-injection image and the pre-injection image. A t-test (two-tailed, unequal variance) was used to compare the rSI for each group of animals. A p<0.05 was considered statistically significant and is indicated by an asterisk.

