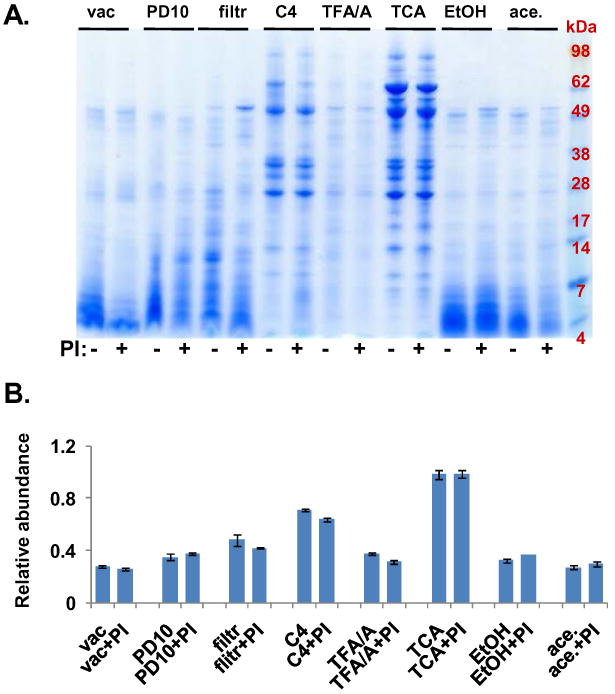
Figure 2. Experiment 1- Comparison of methods to maximize pancreatic fluid protein extraction.

A. SDS-PAGE gel image of pancreatic fluid proteins extracted using the following techniques: vac, vacuum centrifugation; PD10, PD-10 column; filtr, 5 kDa molecular weight cut-off Centricon filtration; C4, C4 trapping column; TFA/A, triflouroacetic acid/acetonitrile precipitation; TCA, trichloroacetic acid precipitation; EtOH, ethanol precipitation; ace, acetone precipitation; PI, protease inhibitors. B. Quantitative gel densitometry measurements of gel lanes (between the 98 kDa and the 7 kDa marker) as determined using ImageJ software. Data points were normalized with respect to the maximum value (TCA plus protease inhibitors).
