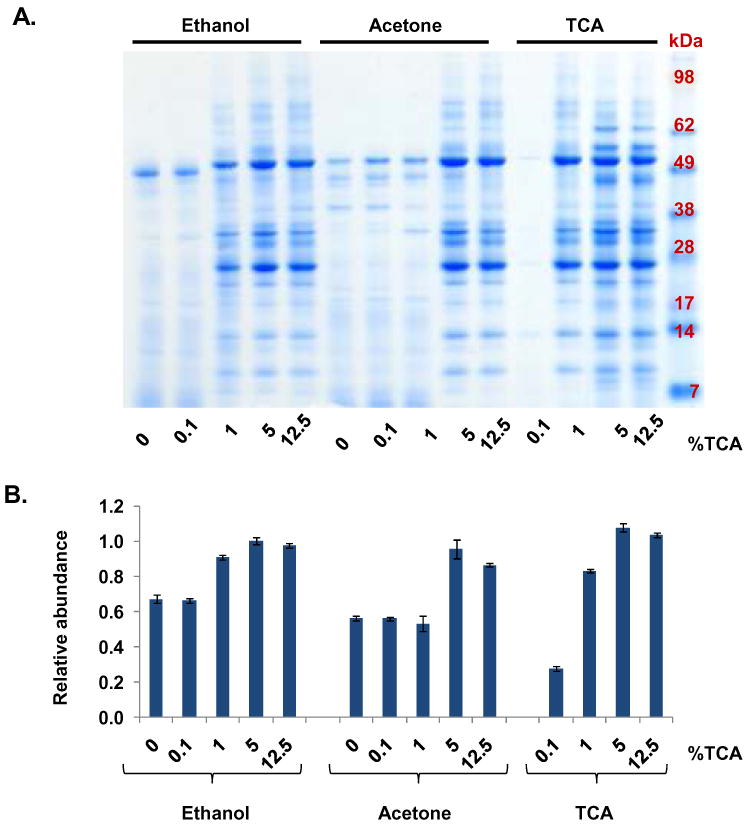
Figure 3. Acidification of pancreatic fluid prior to ethanol or acetone precipitation.

A. SDS-PAGE separation of ethanol, acetone and TCA precipitations of samples containing increasing concentrations of TCA: 0%, 0.1%, 1%, 5%, and 12.5%. B. Quantitative gel densitometry measurements of entire gel lanes as determined using ImageJ software. Data points were normalized with respect to the maximum intensity value.
