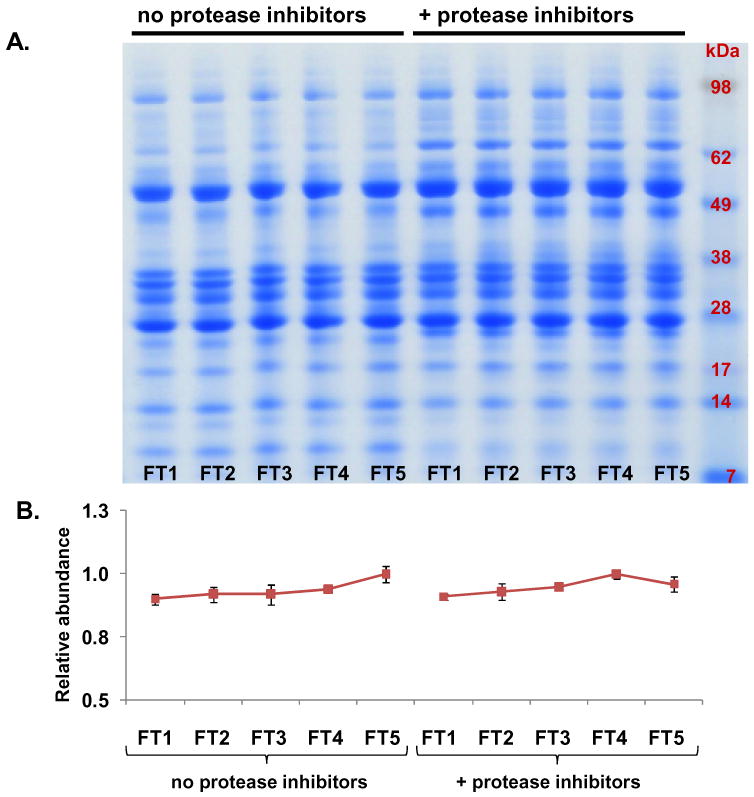
Figure 5. Experiment 3- Evaluation of freeze-thaw (FT) cycles on pancreatic fluid auto-digestion.

A. SDS-PAGE separation of pancreatic fluid samples undergoing a total of five freeze-thaw cycles. B. Quantitative gel densitometry measurements of entire gel lanes as determined using ImageJ software [38]. Data points for each curve were normalized with respect to the reading of the FT1 time point.
