
Figure 4.
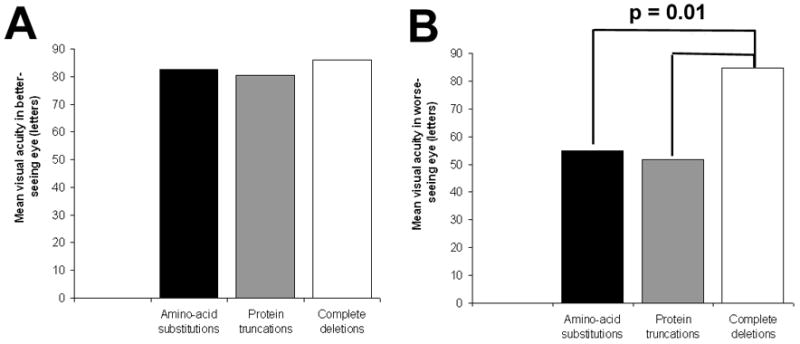
Mean visual acuities in each of 3 genotypic categories. A. Mean visual acuity in the better-seeing eye. There were no detectable significant differences between the means (p > 0.10 for all 3 pair-wise comparisons). B. Mean visual acuity in the worse-seeing eye. Mean visual acuity for complete deletions were significantly higher than those for amino-acid substitutions and protein truncations (p = 0.01).