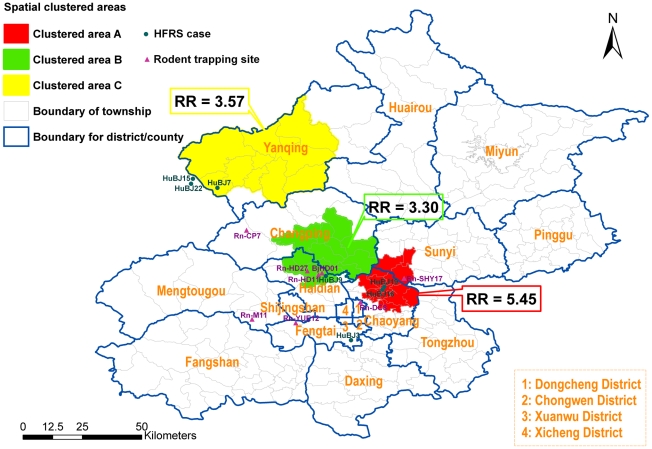
Figure 1. Spatial clustered areas with higher incidence of HFRS using spatial scan statistics.
Spatial scan analysis was performed by moving windows statistics approach. It determined three statistically significant cluster areas (hotspots), designed as cluster area A with a Relative Risk (RR) of 5.45 (P<0.001) (the red area), cluster area B with RR of 3.57 (P = 0.002) (the yellow area) and cluster area C with RR of 3.3 (P<0.001) (the green area). The dots and triangles represent the sites from which sequence data are available, not all human cases or rodent captures in Beijing. The dots represented HFRS cases and the triangles represented the sites where the rodent hosts were captured. HuBJ15 and HuBJ22 were diagnosed in Beijing but their exposed sites fall outside of Beijing. They were included in the figure because they were in vicinity. HuBJ20 were diagnosed in Beijing but the exposed sites of the case were far away from Beijing, thus was not included in the figure.

