
Figure 1.
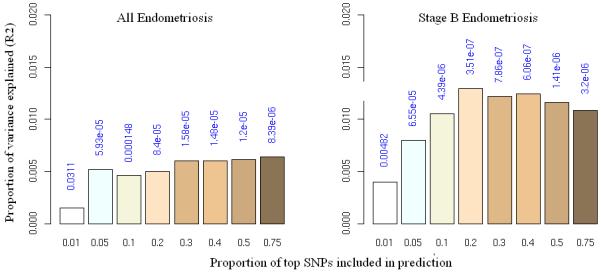
Allele specific score prediction for (a) “all” endometriosis and (b) stage B endometriosis, using Oxford as the “discovery” and QIMR as the “target” dataset. Variance explained in the target dataset on the basis of allele specific scores derived in the discovery dataset for eight significance thresholds (P<0.01, P<0.05, P<0.1, P<0.2, P<0.3, P<0.4, P<0.5, P<0.75, plotted left to right in each study). The y-axis indicates Nagelkerke’s pseudo R2 representing the proportion of variance explained. The number above each bar is the P value for the target dataset analysis. This figure shows that the results were not driven by a few highly associated regions, indicating a substantial number of common variants underlying disease.