Figure 1.
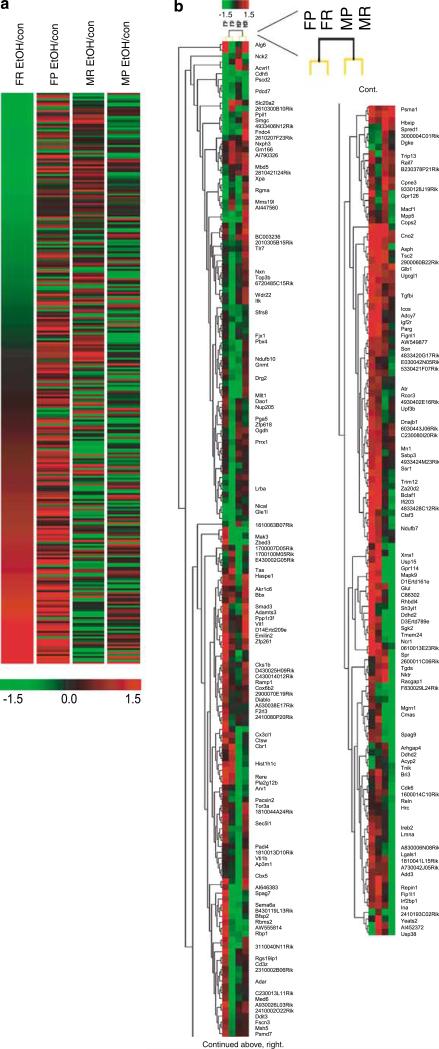
Heat map and hierarchical cluster analysis of significantly differentially expressed genes. Each column represents data from eight array hybridizations, using male and female WSP and WSR selected lines profiled at peak withdrawal following chronic EtOH exposure. (a) EtOH-regulated genes (in one or more comparison) were sorted based on female WSR EtOH expression ratio. (b) Two-dimensional unsupervised hierarchical clustering analysis was performed on EtOH-regulated genes. Experimental groups (arrays), represented by columns, and genes, represented by rows, were clustered according to their similarities in expression pattern. Top of dendrogram shows analysis of similarity of overall array expression profiles. In the zoomed region, bootstrap analysis using 100 resampling iterations confirmed tree topology, grouping arrays based on sex rather than withdrawal phenotype. FP=female WSP, FR=female WSR, MP=male WSP, MR=male WSR.

