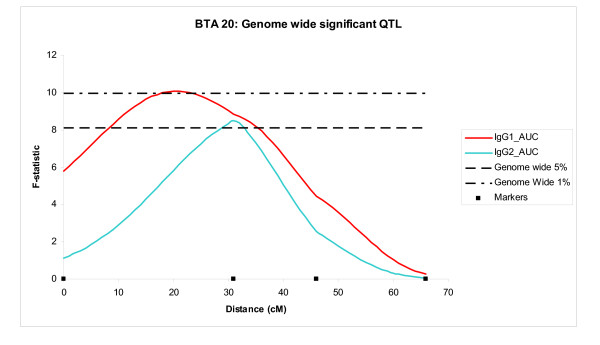
Figure 3.
BTA23: Significant QTL. F-statistic profile and support intervals for IgG1 and IgG2 responses (AUC = area under curve) elicited by FMDV15 peptide, located on chromosome 23. The constant horizontal line represents the threshold of the 1% chromosome wide significance (F = 5.90). Traits are described as Table 1.

