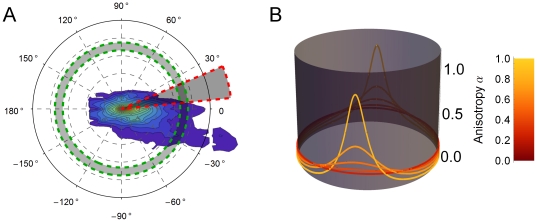
Figure 1. Characterizing axon outgrowth distributions.
(A) The contour plot depicts a typical distribution of axon outgrowth from the site at the origin. The spatial distribution of axon outgrowth was described by an angular distribution function υ(θ), quantifying the relative fraction of outgrowth volume in the infinitesimal sector of the plane centered at angle θ (shaded sector). A radial distribution function S(r) quantifies the fraction of axon volume in the infinitesimal annulus at radius r. (B) The function q(θ;α,η), with parameter α determining the height of its two diametrically opposed peaks, is graphed here on a circular domain for several different values of α. The tilt η is the same for each member of the family shown here, resulting in the peaks occurring at the same values of α and α + 2π for each member. The distribution is almost uniform on the circle for values of α near zero. As α approaches 1, then q(θ;α,η) becomes a delta function.

