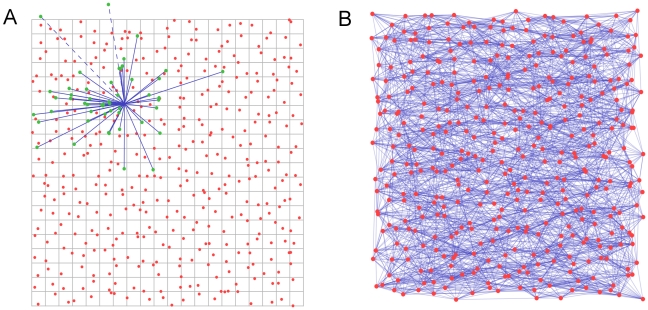
Figure 2. Generating spatial networks.
(A) We begin with a grid of 100µm squares, each containing a node located uniformly at random within the square. For each node, a set of candidate end points for efferent links is drawn from under the probability distribution, those terminating outside the boundary of the region (such as the dashed lines here) will be discarded in favor of new candidates until the quota of naxons has been reached. The ends of the candidate axons snap to the nearest node, and the links are recorded in the adjacency matrix. (B) Repeating the procedure in (A) for each node results in a network such as that depicted here. For clarity of display, the network in (B) is drawn on a grid of  nodes having naxons = 10. Networks used in our simulation have
  and naxons = 10.

