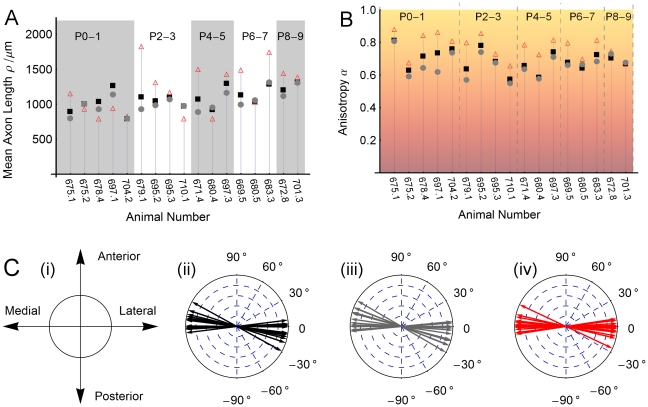
Figure 8. Fitting axon distributions.
(A) The fitted mean length of an axon in the collapsed (black squares), cortex (gray dots) and WM (red triangles) outgrowth distributions for each animal (assuming a gamma distribution with shape parameter equal to 2). (B) Measured anisotropy in the collapsed (black squares), cortex (gray dots) and WM (red triangles) outgrowth distributions for each animal. We note that white matter axons travel more anisotropically than those traversing gray matter. See Figure 1 and the Methods section for details of our approach to quantifying anisotropy in the measured distributions. (C) Preferred direction of travel. (i) Orientation of our coordinate system relative to the anterior/posterior and medial/lateral axes of the cortical hemisphere. The preferred axis of axon travel, shown here for each animal's (ii) collapsed, (iii) cortex and (iv) white matter distributions tends to align closely with the ML axis.

