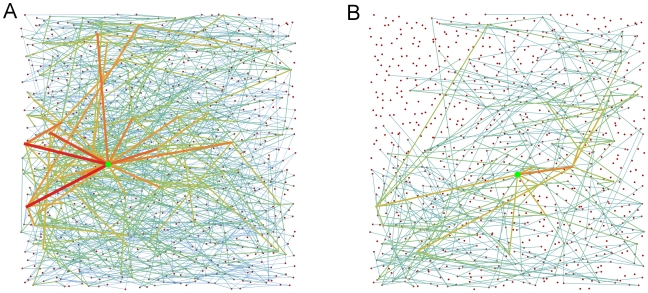
Figure 10. Contrasting nodes of high and low node betweenness centrality on the same network.
(A) and (B) each show a different subset of the shortest paths on the same network. In (A), the node on the graph with the highest betweenness centrality is marked by the green dot. All the shortest paths which travel through that node are shown. Almost 1.5% of this directed graph's N(N - 1) paths pass through the node. The edges used by these paths have color and thickness reflecting the number of paths traversing that edge. By contrast, (B) shows a node of lower betweenness centrality which is on less than 0.1% of the network’s shortest paths. The network has N = 900 nodes, naxons = 5, average axon length 800 µm and α = 0.65.

