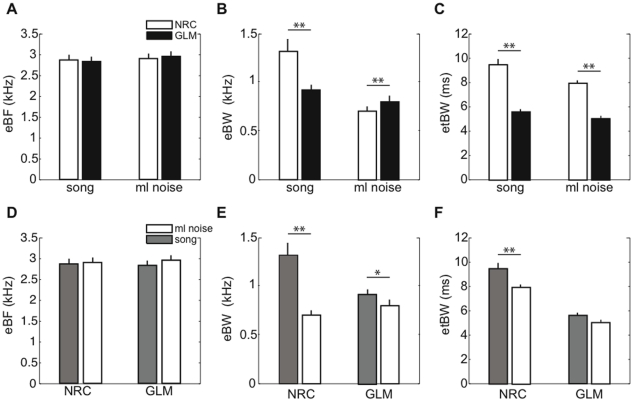
Figure 6. Excitatory tuning differences between GLM and NRC STRFs.
(A)–(C) Comparison of excitatory tuning properties of GLM and NRC STRFs. (A) Best frequency of the excitatory region (eBF), (B) excitatory spectral bandwidth (eBW), and (C) excitatory temporal bandwidth (etBW). We found no significant differences in eBF between NRC and GLM STRFs derived from neural responses to ml noise, or those derived from responses to song (p>0.9, two-sample KS test). However, we found that differences in eBW and etBW determined by the estimation algorithms were highly significant (**p<10-3, two-sample KS test). (D)–(E) Comparison of excitatory tuning properties of song and noise STRFs. (D) eBF, (E) eBW and (F) etBW. We found no significant difference in eBF between song and noise STRFs in ether of the models (p>0.9). Differences in eBW between song and noise STRFs were considerably larger for NRC than for GLM (**p<10−3 and *p<0.05). Finally, we found significant differences between song and noise STRFs in terms of etBW for NRC but not for the GLM (*p<0.05 and p>0.1, respectively). Error bars represent SEs.

