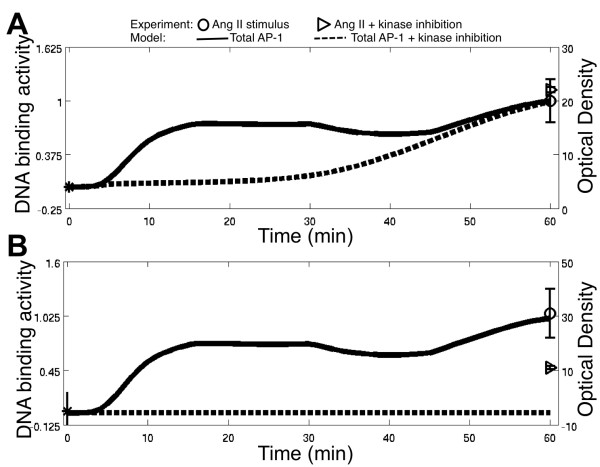
Figure 4.
Effect of kinase inhibitors on Total AP-1 DNA binding activity dynamics. Ang II + kinase inhibitor treatment was simulated by setting the corresponding kinase activity profile to the basal levels present in the absence of Ang II treatment. Experimental data from pathway inhibitor studies were taken from [35] and plotted as the originally reported Optical Density measures (right axis). Experimental data is based on pretreatment of the neuronal cultures (A) with 10 uM chelerythrine chloride, an FRK inhibitor, (B) or with JNK inhibitor II, for 30 minutes prior to Ang II stimulus. (A) Inhibition of FRK. (B) Inhibition of JNK. Symbols: The control unstimulated AP-1 activity at time zero (asterisk), 60 min AP-1 activity in response to 100 nM Ang II stimulus (circle with error bars), 60 min AP-1 activity in response to 100 nM Ang II stimulus in neurons pretreated with a kinase inhibitor (triangle), simulated normalized AP-1 activity in response to Ang II (solid line) and Ang II + kinase inhibition (heavy dashed).

