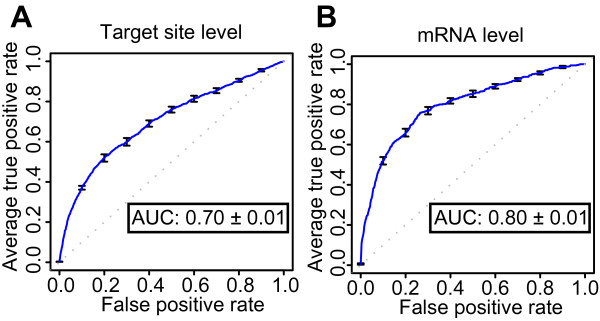
Figure 2.
Target site and mRNA level classifiers provide robust and accurate predictions. The ROC curve shows the average true positive rate (sensitivity) vs. false positive rate of the10-fold cross-validations for the target site (A) and mRNA level (B) classifiers. Error bars show standard errors; the dotted line illustrates random prediction; AUC indicates the average and the standard error of the average of the area under the curve (AUC; ROC Score) of the ten individual cross-validation test results

