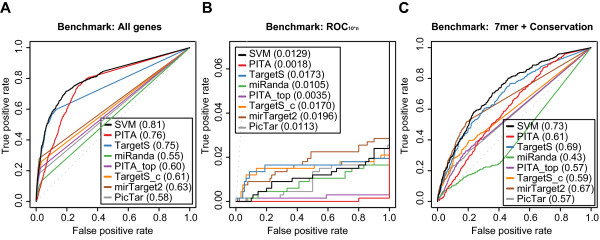
Figure 5.
Benchmarks show the performances of 8 different prediction algorithms. Receiver operating characteristic (ROC) graphs show the performances of 8 different target prediction algorithms - SVM, PITA All (PITA), PITA Top (PITA_top), TargetScan (TargetS), TargetScan with conserved genes (TargetS_c), MicroCosm miRanda (miRanda), mirTarget2 and PicTar - on the Linsley dataset. Dotted lines illustrate random prediction. The ROC scores are shown in the legend box. The benchmarks used for the evaluation were (A) ROC with All genes, (B) ROC10*n, and (C) ROC with 7mer + Conservation

