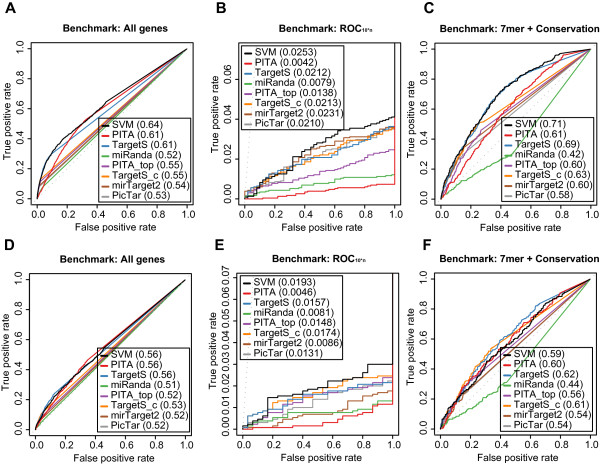
Figure 6.
Benchmark results on proteomics data confirms the two-step SVM's strong performance. Receiver operating characteristic (ROC) graphs show the performance of 8 different target prediction algorithms on the two proteomics datasets, Selbach (A, B, and C) and Baek (D, E, and F). The benchmarks used for the evaluation were (A) and (D) ROC with All genes, (B) and (E) ROC10*n, (C) and (F) ROC with 7mer + Conservation. See Figure 5 for details regarding the algorithms.

