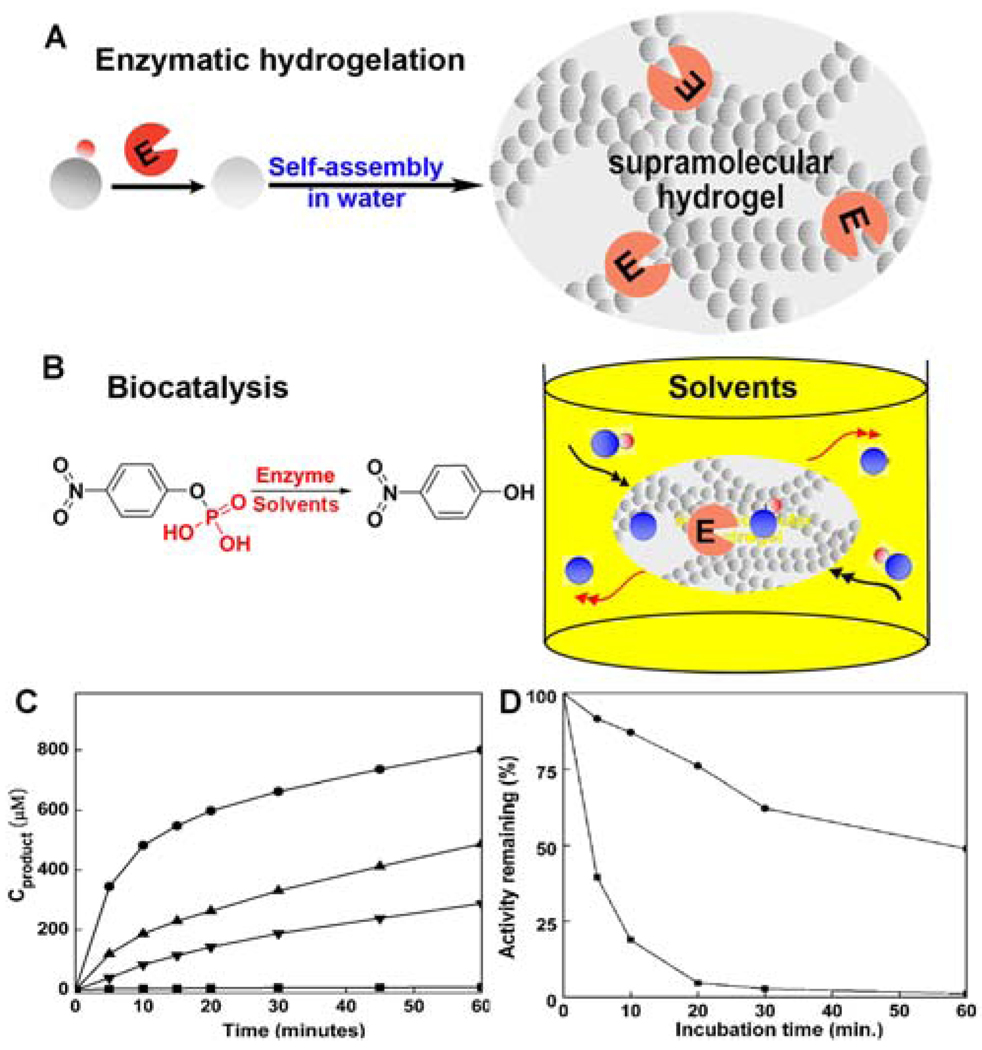
Figure 7.
(A) Illustration to show the location of the enzyme after the formation of the nanofibers in the hydrogel. (B) The acid phosphatase in hydrogel to catalyze the conversion of the substrate (O-phospho-nitrophenol, represented by the blue sphere plus red dot) to the product (nitrophenol, represented by the blue sphere) in organic media. (C) The hydrolysis of the substrate (10 mM) catalyzed by AP (within the gel, 20 µg/L) in chloroform (solid circles), toluene (up triangles), and n-octane (down triangles), and AP (free) in water (squares). (D) The remained activity of AP (within the gel, solid circles) and AP (free) (squares) in water after incubation at 60 °C at various time. Adapted with permission from ref.18. Copyright RSC 2008.

