
Figure 4. Illustration of three mitochondrialy distinct types of LSK cells and their properties.
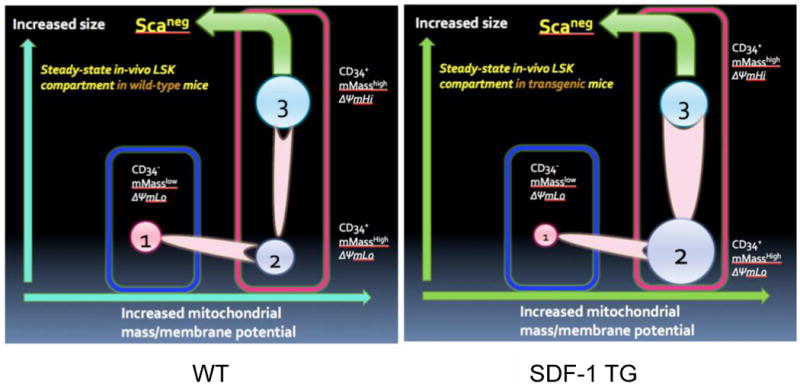
Based on data from Figures 1-3, a model of proposed types of LSK cells in mouse BM is shown (A). The relationships of cell size, mitochondrial mass, and CD34 expression are indicated. The relative proportions of the three types of LSK cells, expressed as mean % of LSK cells +/- S.E. are shown in B. Data from three independent experiments like Figure 3 and 4B, and using the proposed model shown in A, the influence of global SDF-1 transgene expression compared to wild type (WT) on the LSK compartment is modeled (C).