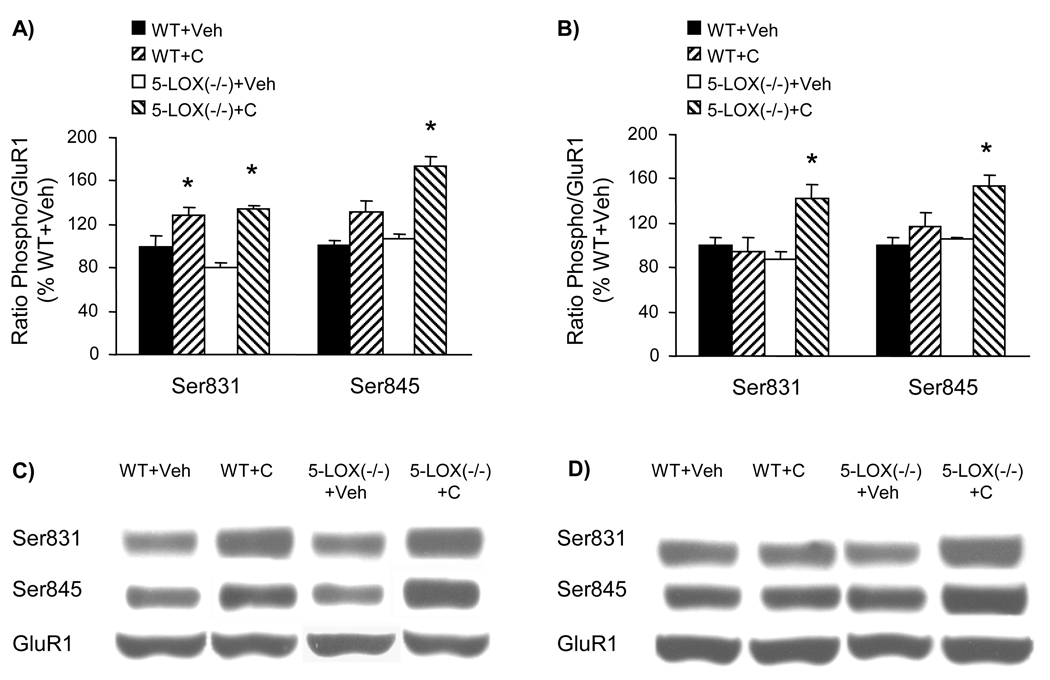
Figure 6.
GluR1 phosphorylation in the frontal cortex and striatum of WT and 5-LOX (−/−) mice under control conditions and after a single cocaine injection. Samples were collected 30 min after i.p. injection (Veh = vehicle; C = cocaine, 20 mg/kg). The phosphorylation status of GluR1 at Ser831 and Ser845 sites was assayed by quantitative Western blot in the frontal cortex (A, C) and the striatum (B, D). The optical density of the phospho Ser831 and phospho Ser845 bands was corrected by the density of the corresponding total GluR1 bands (examples shown in C and D). The results are expressed as a percentage of the corresponding vehicle-treated WT (mean ± S.E.M.; n = 6). *p<0.05 compared to corresponding vehicle-treated controls.

