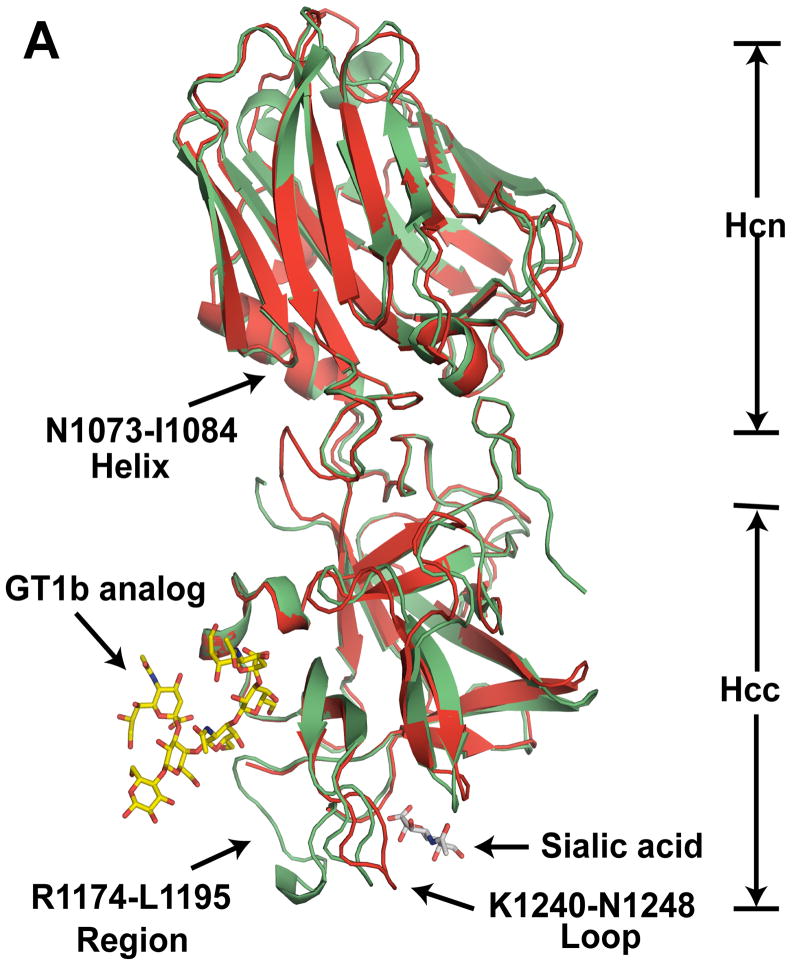
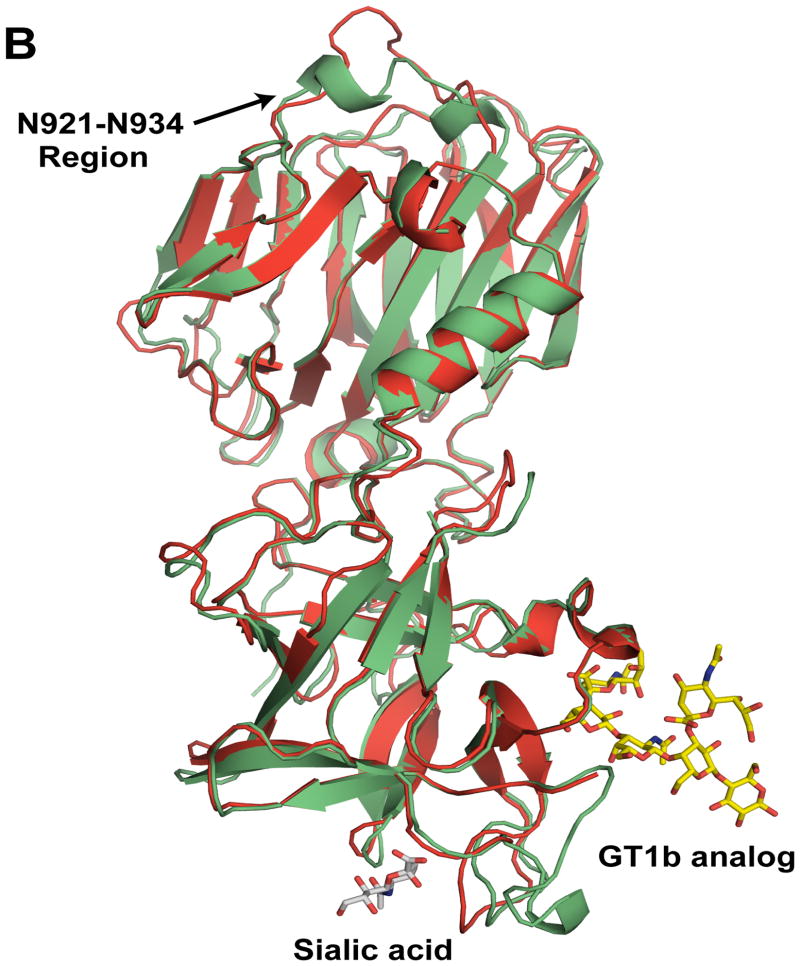
Fig. 1.
Comparison of the crystal structures of BoNT/CD-HCR and BoNT/D-HCR. (A) Cartoon representation of the superposition of the BoNT/CD-HCR crystal structure (green, 3PME) onto the crystal structure of BoNT/D-HCR (red, 3OGG). Also superimposed on the structure of BoNT/CD-HCR are the protein backbones of the structures of the BoNT/A-HCR-GT1b analog complex (2VU9) and the BoNT/D-HCR-sialic acid complex (3OBT) with only the position of the ganglioside co-receptor, GT1b (analog) and sialic acid shown. (B) An approximately 180° rotation of Figure 1A about the y-axis exposes the structural differences in the N921-N934 region. The Hcn and Hcc sub-domains are indicated and important regions are labeled with arrows. Labels for residue numbers in all figures are according to the BoNT/CD-HCR sequence unless specifically stated.


