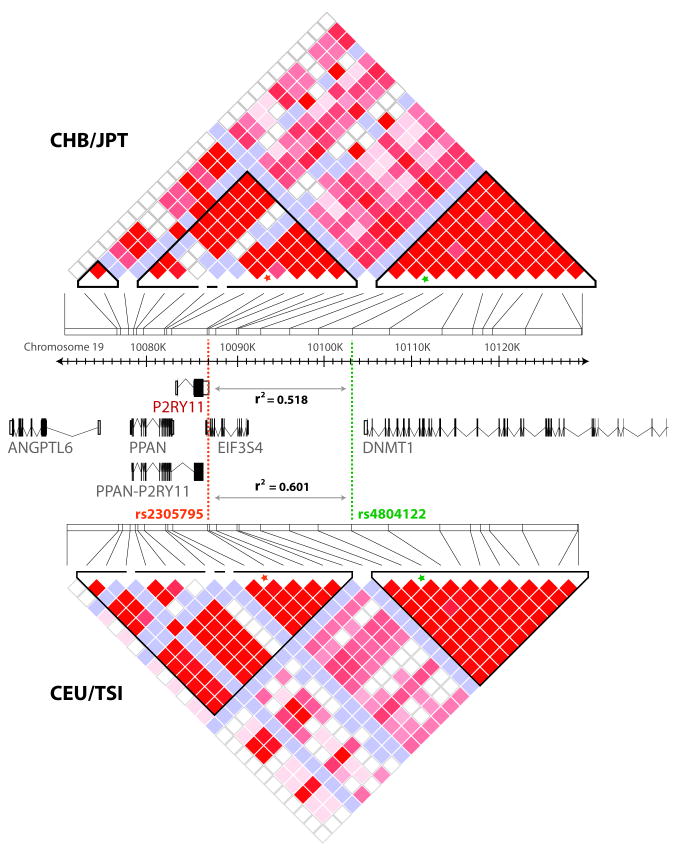
Figure 1.
Risk locus on 19q13.2, showing gene organization and linkage disequilibrium in the region of interest (10,071,000-10,130,000). Top: D′/LOD-based LD plot using data from combined Chinese and Japanese populations (CHB-JPT). Bottom: D′/LOD-based LD plot for individuals of European ancestry only (CEU-TSI). D′ values are calculated from HapMap v3R2 CHB, JPT, CEU, and TSI populations. In addition, r2 values between the original marker, rs4804122 (green) and the best transethnic marker rs2305795 (orange) derived from our own data are indicated. rs2305795 falls in the 3′UTR of P2RY11.

