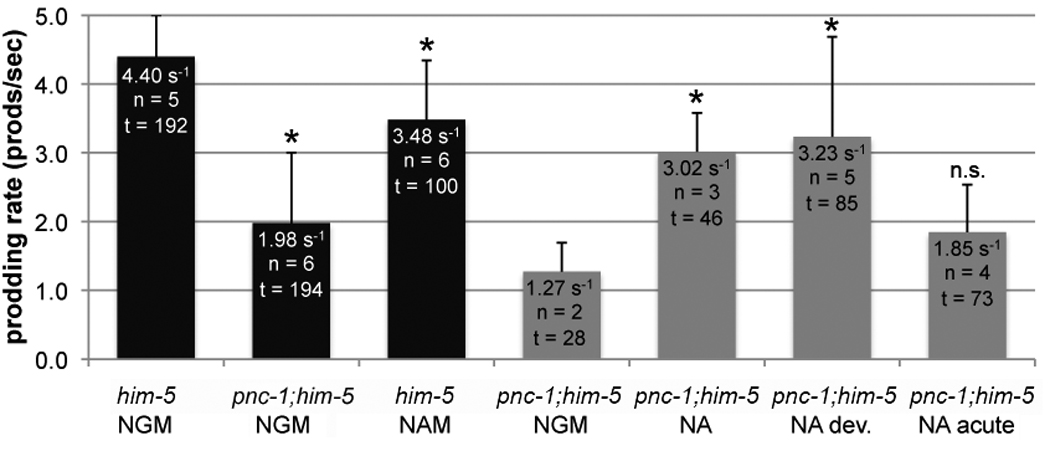
Figure 3. The prodding rate of pnc-1 male spicules is reduced and can be rescued by NA supplementation during development.

Columns represent the rate of prodding. Culture conditions are indicated below the genotype on the x-axis. NGM is normal media. Cultures were supplemented with 25 mM NA and NAM as indicated. The black columns indicate males that were aged 24 hours past the adult molt. Gray columns indicate males that were acclimated for 48 hours post L4 molt to fully separate developmental and acute effects. n = indicates the number of animals observed. t = total time of all prodding attempts in seconds. Bars indicate standard deviation of individual prodding attempts and asterisks indicate a p value < 0.05, calculated using the Mann-Whitney test.
