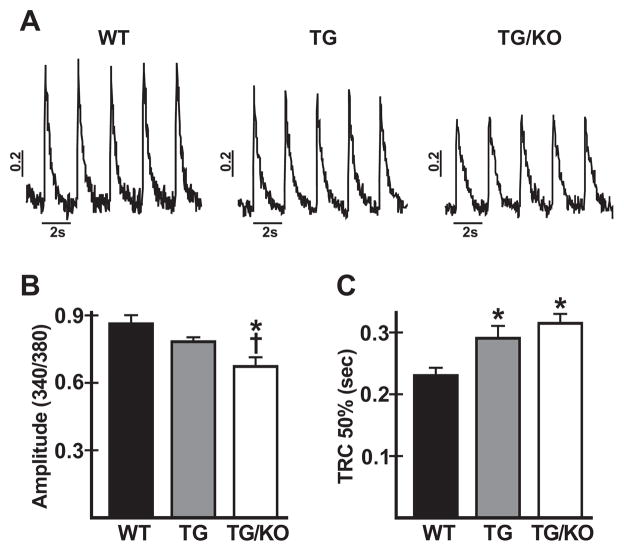
Fig. 8.
Analysis of Ca2+ transients in cardiac myocytes from WT and mutant mice. Myocytes were isolated from 3-month-old WT, TM180 (TG), and TM180/AE3 (TG/KO) mice and loaded with Fura-2AM. Ca2+ transients were analyzed during stimulation at 0.5 Hz. (A) Representative tracings of Ca2+ transients for the three genotypes, determined as fluorescence ratios at 340/380 nm. (B) Amplitudes of Ca2+ transients (systolic - diastolic values) for all three genotypes. (C) Time to 50% recovery of the Ca2+ transient (TRC 50%) for all three genotypes. For all three genotypes, n = 6 mice (4 females and 2 males) with 9–16 cells for each mouse. *p < 0.03 vs WT; †p < 0.05 vs TG.

