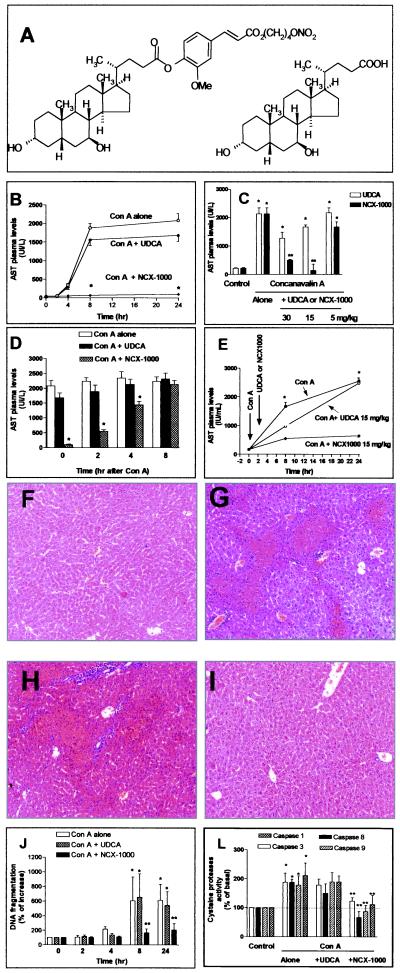
Figure 1.
(A) Structure of NCX-1000 (Left) and UDCA (Right). (B) Time course of AST plasma levels in mice treated with Con A and NCX-1000 or UDCA. *, P < 0.01 versus Con A alone. (C) NCX-1000 causes a dose-dependent reduction of AST release in Con A-induced hepatitis. Data are mean ± SE of five mice for each data point. *, P < 0.001 versus control. **, P < 0.01 versus Con A alone. (D) Effect of treating mice with 15 mg/kg NCX-1000 or UDCA at various time intervals after Con A. *, P < 0.01 versus Con A alone. (E) Time course of AST plasma levels in mice injected with NCX-1000 or UDCA 2 h after Con A. *, P < 0.01 versus con A alone. (F–I) Histological examination of liver sections from control and Con A-treated mice. Paraffin sections were stained with hematoxylin/eosin. (Original magnifications: ×200.) (F) Control mouse. (G) Liver appearance 24 h after Con A administration. (H) Liver section from a mouse treated with 15 mg/kg UDCA, 2 h after Con A. (I) Liver section from a mouse treated with 15 mg/kg NCX-1000, 2 h after Con A. (J) Time course of liver DNA fragmentation. *, P < 0.01 versus basal values. **, P < 0.01 versus Con A alone. (L) Liver caspase activity 24 h after Con A injection. *, P < 0.01 versus control; **, P <0.01 versus Con A alone.

