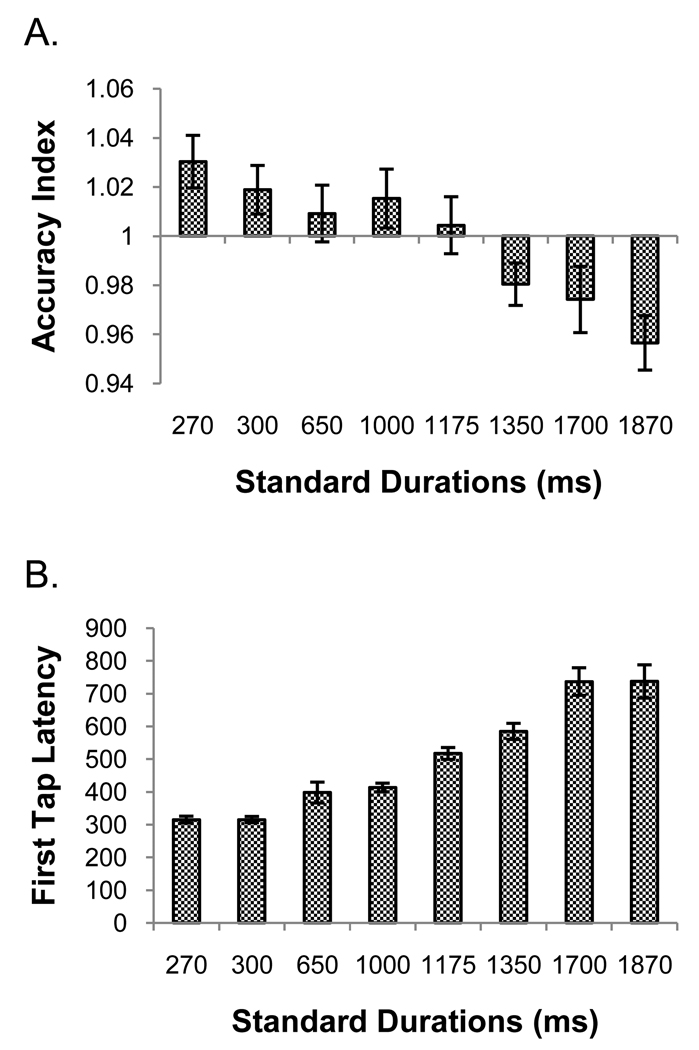
Figure 6.
Panel A shows the accuracy index data from the reproduction task of experiment 2. The abscissa crosses the ordinate at the point which represents perfect accuracy. Values greater than 1 indicate over-reproductions, while values less than 1 indicate under-reproductions. Panel B shows the latency to first tap data for reproduction from experiment 2. Error bars are mean ± 1 standard error.

