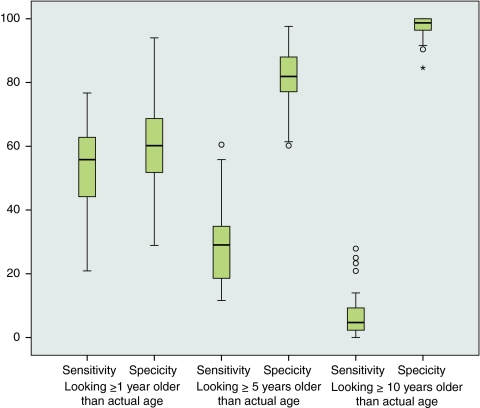
Figure 1.
Sensitivity and specificity of apparent age for the detection of poor health (using the criterion of SF-12 scores ≥2.0 SD below the age group norm). The median for all physicians is denoted by the horizontal line within each box; the interquartile range (IQR) is indicated by the box. Physicians with outlier values (1.5–3.0 IQRs from the upper or lower edge of the box) are denoted by circles.

