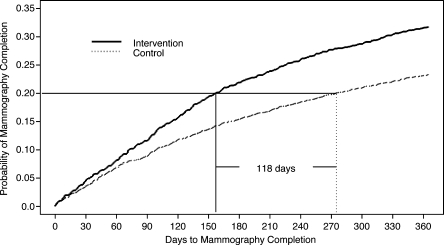
Figure 2.
Kaplan-Meier curve of time to mammography completion during the 1st year of follow-up among women overdue for breast cancer screening in intervention and control groups. The time from the start of the study to the point when 20% of patients had completed screening is depicted by the horizontal line. The difference between the intervention and control populations is depicted by the vertical lines.

