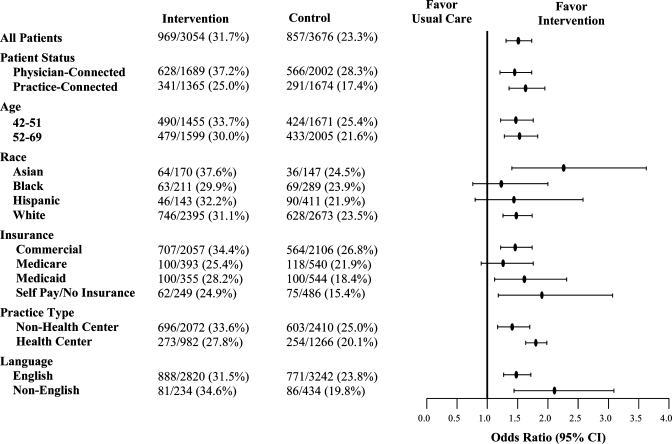
Figure 3.
Adjusted odds ratios and unadjusted rates for breast cancer screening in intervention and control groups in patient and practice subgroups. Odds ratios compare patients in intervention and control groups controlling for patient age, patient-physician connectedness, race/ethnicity, English language proficiency, practice type (health center vs non-health center), and number of months since last practice visit using cluster analysis with generalized estimating equation methods. For each subgroup analysis, the analogous covariable was removed from the model.

