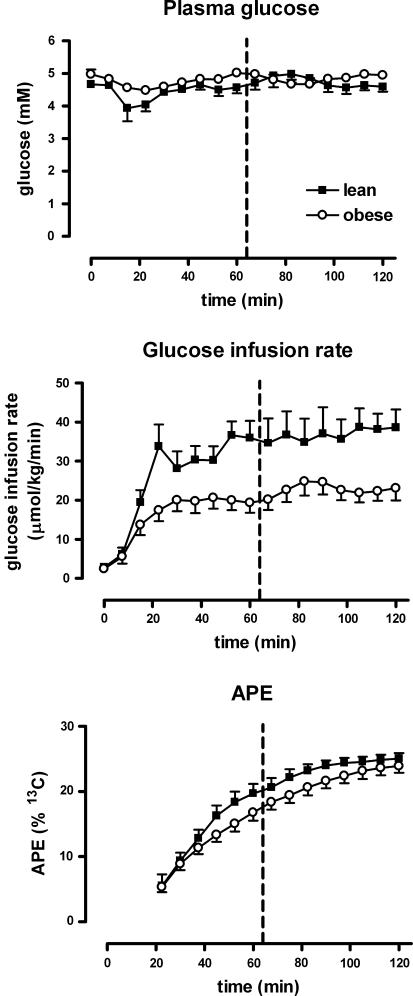
Fig. 1.
Euglycemic hyperinsulinemic clamp procedure. Glucose remains constant, while insulin levels increase. Time series of plasma glucose (upper row), glucose infusion rate (middle row) and increase in APE 13C glucose in blood due to [1-13C]glucose infusion (lower row). Data for lean subjects are indicated by black squares and data for obese subjects by open circles. The dashed vertical line indicates the time at which the exercise was performed

