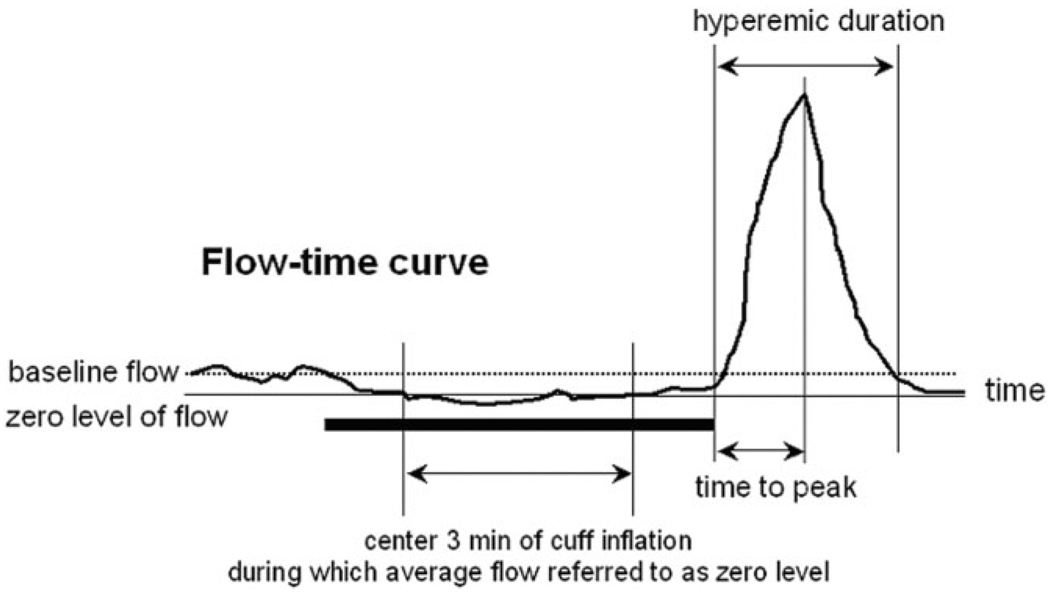
Figure 1.
Schematic illustration of the indexes measured in this study. The thick horizontal line indicates the five-minute cuff inflation. The average flow over the center three minutes is chosen to be the zero level while the average flow before cuff inflation is defined as the baseline. The hyperemic flow volume is the flow integral in hyperemic duration that is measured from the first positive deflection after cuff release to the time when flow returns to zero level.

