
Figure 2.
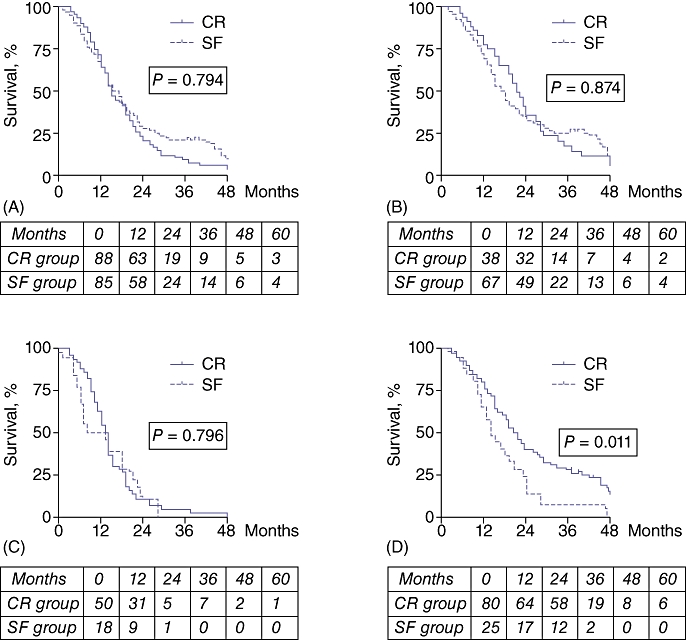
Survival curves for all patients and for resected and non-resected patients. The tables under each graph give the number at risk. (A) Overall survival. Median survival is 15 months (range: 3–72 months) in the chemoradiation (CR) group and 17 months (range: 1–109 months) in the surgery-first (SF) group. Three- and 5-year survival rates are, respectively, 10% (95% confidence interval [CI] 5.3–7.6) and 2% (95% CI 2.0–5.3) in the CR group, and 21% (95% CI 8.4–9.8) and 8% (95% CI 5.5–9.6) in the SF group. (B) Survival of resected patients. Median survival is 21.5 months (range: 5–72 months) in the CR group and 18 months (range: 2–109 months) in the SF group (non-significant). Three- and 5-year survival rates are, respectively, 15% (95% CI 9.4–13.7) and 3% (95% CI 2.8–10.2) in the CR group, and 26% (95% CI 10.2–11.4) and 10% (95% CI 6.9–11.6) in the SF group. (C) Survival of non-resected patients. Median survival is 13.5 months (range: 3–69 months) in the CR group and 10.5 months (range: 1–28 months) in the SF group (non-significant). Three- and 5-year survival rates are 2% (95% CI 1.8–7.2) in the CR group and 0% in the SF group. (D) Survival of patients with R0 vs. R1 margins. Median survival is 20 months (range: 2–109 months) in R0 patients and 14 months (range: 4–47 months) in R1 patients