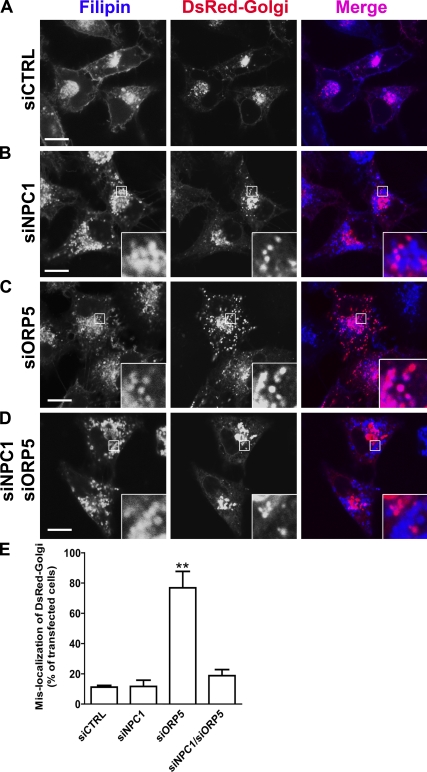
Figure 5.
The localization of DsRed-Golgi in cells depleted for ORP5, NPC1, or both. (A–D) HeLa cells grown in medium A were transfected with siCTRL (A), siNPC1 (B), siORP5 (C), or siNPC1 and siORP5 (D) for 48 h, followed by transfection with the Golgi marker DsRed-Golgi for 6 h. Cells were treated with 50 µg/ml LDL in medium D for 18 h followed by processing for filipin staining. Confocal fluorescence images are shown. Data are representative of three independent experiments with similar results. Enlarged views of the boxed regions are shown in the insets. Bars, 10 µm. (E) Quantification of DsRed-Golgi mislocalization in A–D. Values are the percentage of transfected cells with mislocalized DsRed-Golgi marker (means + SD [error bars], n > 80; **, P < 0.01).

